The ‘Core Vote, Swing Vote’ fallacy
There are core voters in every social group, just as there are swing voters in every social group. On one level, of course, the answer to why Labour lost so catastrophically in 2010 is simple: we had presided over an enormous...
There are core voters in every social group, just as there are swing voters in every social group.
On one level, of course, the answer to why Labour lost so catastrophically in 2010 is simple: we had presided over an enormous economic collapse, had an unpopular leader, had little in the way of an exciting policy agenda, and had, as a result of the accumulated errors, mistakes and malfunctions of government, lost our significant leads on many issues important to voters.
But this is only part of the story. After all, it’s hard to argue that the Labour government of 2005-2010 was more incompetent, more riven by division, more scandal-ridden than the Conservatives from 1987-1992. Yet they won with their highest ever vote total, and we lost with one of our lowest.
So did something deeper than the obvious cause our electoral defeat?
The key point most centre-left analysis of the decline of the New Labour coalition proceeds from is the fact that between 1997 and 2010 Labour’s vote total declined by just under 5 million, while the Conservatives gained only a million extra voters.
The most detailed version of this argument was produced by the Smith Institute in its pamphlet Winning Back the Five Million which, correctly states:
“Between 1997 and 2010 Labour lost a staggering 4.9 million votes. Some of this loss can be explained by a drop in turnout (some 1.6 million fewer voted in 2010 than 1997). Traditionally the Conservatives would have gained where Labour lost but the biggest winners were the Lib Dems in absolute terms, and some of the fringe parties in the percentage rise of their vote.”
The Smith institute paper is strictly a factual discussion, but in other hands this data has been used to argue this fact should be a guide to Labour political strategy. As Polly Toynbee has said:
“Since 1997 Labour has lost 5 million votes, but only 1 million to the Tories – the rest to the Lib Dems or nowhere. So what suggests Labour was too left, or that tacking towards Cameron now is the route back to power?”
Building on this, the argument has been made that the underlying cause of Labour’s defeat was a particularly heavy departure of voters from social class DE between 1997 and 2010.
This case was perhaps most clearly expressed during the Labour leadership campaign, when Ed Miliband’s campaign team produced a report that showed that Labour had lost almost a third of its support among members of social class DE, with a vote share falling from 59 per cent in 1997 to 40 per cent in 2010.
Writing in a Fabian Essay, the future Labour leader argued that “five million votes were lost by Labour between 1997 and 2010, but four out of the five million didn’t go to the Conservatives. One third went to the Liberal Democrats, and most of the rest simply stopped voting”.
Ed Miliband argued further that “between 1997 and 2010, for every one voter that Labour lost from the professional classes, we lost three voters among the poorest, those on benefits and the low paid. You don’t need to be a Bennite to believe this represents a crisis of working class representation for Labour – and our electability.”
The decline the Ed Miliband campaign reported is factually correct. Between 1997 and 2010 Labour support among DE voters fell from 59 per cent to 40 per cent, and this large shift translates to just over one and a half million voters in current terms*.
During the Labour leadership campaign, it was pointed out that merely achieving a 1997 vote share among DE voters alone, with no change anywhere else, would have been enough for Labour to be the largest party in the House of Commons in 2010. Because of this scale, the argument that Labour’s defeat is best viewed in the light of a decline in DE support has become something of a recurring theme among centre-left writers.
Ultimately, what all these analyses boil down to is Ed Miliband’s argument in the Labour leadership campaign that “our core vote became our swing vote” and “our working class base cannot be dismissed as a core vote”.
Clearly, you don’t lose a third of your support among a social class without there being something wrong. The question is what?
About a core
First, let’s clarify a few things. First, we need to decide what a ‘core vote’ is.
On one reading, any DE voter ‘should’ be a core Labour voter, because their interests are so clearly identified with Labour. It is tempting therefore to define DE voters as ‘core Labour voters’ – but the corollary is that any AB voter ‘should’ be a Tory core voter, which is, clearly, nonsense.
Obviously, voters of every social class vary in their electoral preferences. So when deciding who is a core voter, it is worth considering that the ‘core’ Labour vote among DE voters may be smaller than it appears, and that selecting Labour’s 1997 landslide distorts the history of Labour support among DE voters.
So in choosing to define Labour’s ‘core’ we have to understand that your core should perhaps not be defined by your best ever performance. Those who say Labour needs to win back ‘five million lost voters’ and highlight the ‘DE decline’, measure Labour’s electoral performance in 2010 against the rather unusual baseline of 1997. But 1997 was a landslide Labour election victory, and 2010 an epic defeat. To subtract vote totals from one to the other and attribute the difference to an inattention to the needs of ’core’ voters is overly simplistic.
Simply put, Labour’s 1997 support among DE voters was far from being a ‘core vote’.
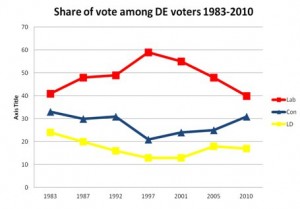
Chart 1 shows Labour’s vote share among DE voters in every election since 1983, as measured by Ipsos-MORI.
Chart 1:
What does this tell us? Well, first of all it tells us that when the Labour party is nationally unpopular, we do much worse among DE voters than when we are popular. It also suggests that 1997 was an unusual election, as support for Labour was massively increased from both 1987 and 1992 among DE voters.
If the chart were cut-off at 1997, one might argue that the more ‘New Labour’ the manifesto, the greater the DE social class responds by voting Labour.
By 2005, Labour support among DE voters had declined all the way back – to the levels of support won by Neil Kinnock in 1987 and 1992. If Labour lost DE support after 1997, it did so to the same extent Labour under Kinnock and Blair gained support from 1983. So, in what sense can this group, which varies so greatly in voting choices over time, be deemed ‘core’ voters? They cannot, because they are not. They are swing voters, who are in the DE social group.
However, even if it is the case that to take the 1997 ‘peak’ of DE support for Labour as a baseline for working class ‘core’ support is incorrect, that doesn’t mean Labour might not have a significant problem.
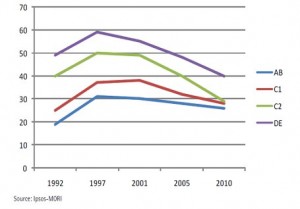
First, it is true that support for Labour has declined more sharply among DE voters than any other social class. Chart 2 is from the Smith Institute pamphlet Winning Back the Five Million.
Chart 2:
From this we can see that Labour support increased substantially from 1992-1997 across all social groups, and declined among all social groups after 2001, with the sharpest decline coming among C2 and DE voters.
Yet looking at the data this way can be misleading. We also need to look at how the Labour’s share of vote in one social class compares to our share of vote overall.
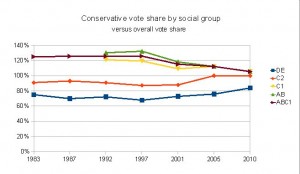
Chart 3 is an attempt to set this out, comparing the MORI data for each social class to the overall result MORI identified for that election. Effectively, this seeks to measure how likely a voter in a particular social class is to vote Labour, compared to the ‘average’ Labour voter. If MORI reports Labour scored 40 per cent among DE voters, but 30 per cent overall in the 2010 general election, this would appear here as a score of 133 per cent.
Chart 3:
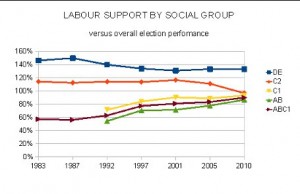 This shows a much more stable picture for Labour’s support among social group DE, with support consistently at 130 to 140 per cent of Labour’s total polling performance from 1992 onwards. What becomes really striking when we look at relative, not absolute electoral performance, is Labour’s sharp relative decline among C2 votes from 2001 to 2010.
What does this tell us?
First, although Labour has undoubtedly lost the support of a large number of DE voters, it has lost them in numbers largely in line with their significance to the Labour electoral coalition over the last three decades.
Throughout the Kinnock-to-New Labour ‘era’ DE voters were roughly a third more likely to vote Labour than the nation as a whole did. The total shifts are numerically higher, because DE voters are an important part of our electoral coalition, and the percentage shifts are dramatic, but seen in relative terms, Labour’s DE support has been remarkable consistent.
However, where we have seen negative change, is that Labour’s relative support among C2 voters has declined significantly in recent elections.
This shift in support is a further reminder that a politics of ‘core’ and ‘swing’ does not easily translate into social groups. There are core voters in every social group, but there are also swing voters in every social group. So where have these swing voters gone?
As being in social class C2 or DE doesn’t, of itself mean you are a Labour core voter, we should look carefully at the Conservatives performance in these groups, as well as at our own to see if our decline is related to a Conservative recovery.
What about the Tories?
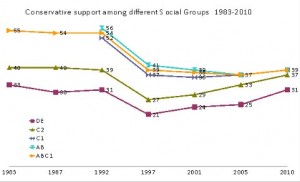
Chart 4 shows Conservative support broken out by social class over the last seven elections.
Two things stand out. First, the 1997 election was absolutely seismic for the Conservative party and they have not recovered support in their 83-92 key segments.
Chart 4:
The second is that their post 1997 recovery looks as if it has been driven primarily by a recovery among C2 and DE voters, not by AB or C1 voters. Among C2 and DE voters, the 2010 Conservatives were at roughly the support level they enjoyed from 1983 to 1992.
Their failure to secure to a similar majority in 2010 to those elections can be explained by a sustaining of their post 1997 failure among the AB and C1 social groups. If they were to add increased support among AB and C1 voters to their existing C2 and DE support, they would likely win significant majorities.
In other words, among C2 and DE voters, there was a recovery of Conservative fortunes.
However, this chart doesn’t take account of the Conservatives relative performance, so let’s look at how the Tories did in each social group compared to how they performed in the UK as a whole.
Chart 5:
Chart 5 confirms that, compared to the 80s and 90s, the Conservatives in 2010 did historically well among C2 and DE voters in relative terms.
Among C2 voters the Tories scored about as well as they did nationally for the first time, while among DE voters, the Conservatives increased their support to over 80% of their national vote share, again, a high in recent history.
On the other hand, the Conservatives did not see a significant increase in either the AB or C1 groups vote between 2005 and 2010, so their relative performance declined.
One explanation for this trend might be that the UK electorate is increasingly homogenising in terms of vote choice and class, with voters from different social classes making increasingly similar choices.
Indeed, as the C2 and DE groups contract, there may be cultural and political cross-over, as voters/demographic groups who have consistently identified with Labour are re-classified into new social groups
However, to the extent that we are considering Labour’s prospects with those classified today as being in ‘working class’ social groups, this should remind us that Labour’s decline there has in large part accompanied by a Conservative recovery among C2DE voters.
Conservative support among C2 and DE voters has simply returned in 2010 to the levels they enjoyed in 1987 and 1992. In other words, there has been a C2DE swing back to the ‘pre-New Labour’ era.
This again suggests we cannot simply assume that the way to win C2 and DE voters over is to follow a ‘core vote’ strategy. The C2 and DE voters have chosen to support the Conservatives in significant numbers. Of course, this does not mean that C2 and DE voters do not have different interests to AB and C1 voters. They are, overall, far more likely to be Labour supporters. But within each social group, from A to E, there are core Labour voters, swing voters and strong Conservative voters. After all, even in 1997 the Conservatives gained 21 per cent of the votes among DE voters.
What about turnout?
One possible counter-argument is that the real differential decline in turn-out between social groups provides a source of potential ‘core’ voters who could be attracted with a ’traditional’ left message.
One answer might be to point out that in a first pass the post system, this might not matter very much if such voters are geographically located together in safe Labour seats, but both as democrats and as believers in equity we should reject such an analysis.
While turnout has declined among all social groups, it has declined most strongly among DE voters. However, we should be wary of assuming that the reason turnout has declined is because Labour’s traditional supporters alone have deserted it.
Considering that the peak of C2 and DE support in both votes and share of vote was the ultra-centrist manifesto of 1997, significantly above the support level received in 1983, 1987, 1992, this does not lead to the immediate conclusion that there exists a pool of dissatisfied left-of-centre voters in the C2DE class, to whom it would be possible to appeal without any political price elsewhere.
However, in order to see if there is such a group, we can look to see if there is evidence that there is a significant class differential in issues, leadership or party performance ratings, which might identify potential areas which might motivate such potential voters back to the polls.
(Also we should bear in mind that ABC1C2DE social groupings, being based on profession, are also subject to changes in population size. There has been a significant decline of the numbers in the DE social class in recent years. Whether this might in and of itself have caused an apparent decline in turnout – i.e. if there was a differential turnout between ‘old’ DE voters and ‘current’ DE voters – is something which should be explored.)
So why did people switch?
Fortunately we can examine the polling data on key issues to see if there are significant differences between social groups on the issues, and how they view the political parties.
We can first look at the polling data on the most ‘important issues’ for each social group, to see which issues are most salient, and if there is a difference in issue importance by social class.
In a YouGov poll conducted in the run up to the 2010 general election, we can see that C2DE voters regarded the economy as the overwhelming issue but to a slightly lesser extent than ABC1 voters, with crime and immigration receiving slightly more attention.
This suggests that C2DE voters saw crime as slightly more important (+6 over ABC1 voters) and education as of slightly less concern (-4 vs ABC1 voters) (find link to poll)
Looking at the differences between the C2 and DE groups, we can look at polling done by Ipsos MORI.
In March 2010 Mori carried out their regular polling on the most important issues facing Britain, and as ever with their issues index, broke the data out by social group. This found some surprising conclusions. First, concern about education and the NHS was much more important to AB voters than C2 or DE voters.
More than three times as many AB voters were concerned about education, and over twice as many about the NHS. It occurs to me that this concern for public services may, counter intuitively have a role to play in Labour’s relative success in the election among these groups.
Correspondingly, DE voters were significantly more concerned about crime, inflation and unemployment. Finally, all social groups were concerned by immigration, but it is of particular concern to C1 and C2 voters.
If these are the issues that were important to voters, what did they think of Labour’s achievement and offers, and does this vary by social group?
In late April 2010 YouGov asked voters how they thought Britain had done under the Labour government in recent years. (Note this poll was completed at the height of the Lib Dem surge, and reported that the Lib Dems had a strong poll lead among C2DE voters. Another reminder of the treacherous nature of thinking about ‘core” votes.)
What is startling about the answer is how small a variation we see between social groups. In almost every case, C2DE voters gave the same assessment of political progress as ABC1 voters. The only noticeable difference was that C2DE voters thought more had been done for pensioners.
| Progress made in last few years on | |||
| ABC1 | C2DE | ||
| Build a Strong Economy | |||
| Some/Lot | 26 | 27 | |
| Not much/None | 72 | 70 | |
| Improve NHS | |||
| Some/Lot | 47 | 46 | |
| Not much/None | 50 | 51 | |
| Improve Education in state schools | |||
| Some/Lot | 37 | 40 | |
| Not much/None | 58 | 54 | |
| Reduce Crime Rate | |||
| Some/Lot | 35 | 34 | |
| Not much/None | 62 | 62 | |
| Improve living standards of retired | |||
| Some/Lot | 23 | 29 | |
| Not much/None | 71 | 64 | |
| Sensible policies toward immigration/Asylum | |||
| Some/Lot | 16 | 17 | |
| Not much/None | 81 | 78 | |
So if the electoral verdict on Labour was shared across social classes, what about Labour’s future offer? YouGov also asked in late April 2010 what voters expected from a Labour government.
Looking at this by social group, we again find little difference in expectations for a Labour government:
| If Labour win (YG 21 April 2010) | ABC1 | C2DE | |||
| Quality of Education will improve | |||||
| Will | 23 | 26 | |||
| will not | 57 | 51 | |||
| Crimes committed will fall | |||||
| Will | 16 | 20 | |||
| will not | 60 | 60 | |||
| Fewer Immigrants and Asylum seekers | |||||
| Will | 16 | 17 | |||
| will not | 62 | 62 | |||
| Britain’s Economy will grow stronger | |||||
| Will | 36 | 37 | |||
| will not | 40 | 39 | |||
So, C2DE voters generally thought the same issues were important as ABC1 voters, and were just as critical as ABC1 voters about Labour performance and as pessimistic about our likelihood of making progress in future
But of course, pessimism can be general, as well as party specific. Just because voters didn’t think Labour and Gordon Brown would reduce asylum claims doesn’t mean they thought the Conservatives and David Cameron would do any better. But comparing two YouGov polls taken in the run up to the 2005 election with polls taken in the run up to the 2010 election shows small, but noticeable declines in C2DE approval ratings for the government, a decline in those thinking the Labour leader would make the best prime minister, and a major increase in the number of C2DE voters who think the Tory leader would make a good prime minister. On the issues, the most noticeable shifts are from a strong Labour lead on education and unemployment to an effective tie, and an equally big shift on the economy away from Labour. (However, this latter varies in the question asked, so should not be taken as definitive.)
| C2DE voters | 22-24 Feb 2005 | 21-24 March 05 | 28/29 March 2010 | 05-Apr-10 | |
| Govt Approval | 30 | 31 | 24 | 26 | |
| Govt Disapproval | 53 | 54 | 60 | 58 | |
| Blair/Brown best PM | 37 | 33 | 28 | 30 | |
| Howard/Cameron best PM | 17 | 20 | 33 | 30 | |
| Kennedy/Clegg best PM | 14 | 17 | 9 | 9 | |
| Lab Lead on | |||||
| NHS | 14 | 10 | 4 | 9 | |
| Asylum | -18 | -18 | -24 | -18 | |
| Law and Order | -5 | -9 | -11 | -18 | |
| Education | 10 | 1 | |||
| Tax | 2 | 2 | -9 | 0 | |
| Unemployment | 21 | -3 | 4 | ||
| Economy overall | 16 | 17 | -3 | 2 | |
So the evidence suggests that C2DE voters thought that in 2010 Labour had been a worse government and a weaker leader than in 2005 and were no longer the best party on education, unemployment and the economy.
Set against this, the 2010 Tories had a more appealing leader than before and were even more firmly the best party on immigration and crime. So Labour had lost our advantage on the most important area (economy/unemployment) and did significantly worse than the Conservatives on other key issues for C2DE voters (crime, immigration).
Interestingly, the shift in C2DE voter attitude was similar to the shift in ABC1 attitudes, except that the ABC1 voters started from more Conservative friendly positions.
But as we have seen, there was a significant relative decline in Labour support among C2 voters, but not in DE voters. Is there any evidence to suggest a significant shift in attitudes among C2 and DE voters?
The following is from MORI’s March 2010 survey, and shows how DE voters saw each party by key policy.
| Mori March 2010 | ||||
| DE voters:Best Party on | ||||
| Lab | Con | LD | Lab Lead | |
| Education | 29 | 26 | 10 | 3 |
| Healthcare | 36 | 21 | 9 | 15 |
| Economy | 27 | 23 | 11 | 4 |
| Taxation | 30 | 16 | 11 | 14 |
| Benefits | 37 | 16 | 6 | 20 |
| Asylum/Immig | 17 | 23 | 6 | -6 |
| Crime | 26 | 27 | 7 | -1 |
As can be seen, Labour retained significant leads on health, tax and benefits among DE voters, held small leads on the economy and education, and an effective tie on crime, with only a small lead for the Conservatives on asylum and immigration.
However, the same story is not true for C2 voters.
| Mori March 2010 | ||||
| C2 voters:Best Party on | Lab | Con | LD | Lab Lead |
| Education | 27 | 30 | 9 | -4 |
| Health | 29 | 24 | 7 | 5 |
| Economy | 23 | 30 | 9 | -7 |
| Taxation | 23 | 29 | 11 | -6 |
| Benefits | 26 | 27 | 6 | -1 |
| Asylum | 11 | 28 | 9 | -17 |
| Crime | 21 | 29 | 10 | -8 |
(variances due to rounding)
Among C2 voters, the Conservatives held a lead in all areas, bar healthcare. Areas of strength amongst DEs for Labour, like benefits and tax, did not exist among C2 voters, while skilled workers (more concerned about immigration in the first place, as we saw earlier) showed a major preference for the Conservatives on immigration.
Indeed, among C2 voters, the Conservatives did better on most policy questions than they did among C1 voters, and almost as well as they did among AB voters.
It would be instructive to compare the 2005 and 2010 ratings to see how much has changed, but sadly the online data available doesn’t permit this.
Despite this, I think we can begin to see why there was a significant improvement in the Conservative’s relative performance among C2 voters and a significant decline for Labour.
Conclusion
This analysis suggest that in 2010 Labour were reduced to something close to our ‘core’ support in both social class C2 and DE, achieving in absolute terms a 1983-style result. Significantly, among C2 voters, Labour’s relative collapse since 2005 was far greater than among DE voters, suggesting that Labour had little to offer this group.
Conversely, the Conservatives achieved a strong result among C2 and DE voters, suggesting that they had succeeded in convincing many swing C2 and DE voters that they would be more effective on the economy than Labour, stronger on crime and immigration, while Labour held only a small lead on protecting services. This impact is particularly strong among C2 voters, which perhaps explains the Conservatives strong performance among this group.
From this, we can conclude that if Labour wants to win back C2 and DE voters, it should not pursue a ‘core’ strategy, as the Conservative improvements on votes, issues and leader ratings among C2 and DE mean these voters are not disillusioned left voters who have abandoned Labour for the sofa, but have instead embraced David Cameron’s Conservatives. To win them back, we need to convince them that we have the right leadership team, are trusted to deliver on the economy, will produce better public services, and, if possible, to be more effective in reducing crime than the current government.
*The Ed Miliband campaign, quite rightly, adjusted the figures to reflect the changing class structure of British society. I just wanted to mention this, because it’s nice to see someone doing this sort of thing right. Kudos.
Hopi Sen is a Labour blogger and co-author of In the Black Labour

